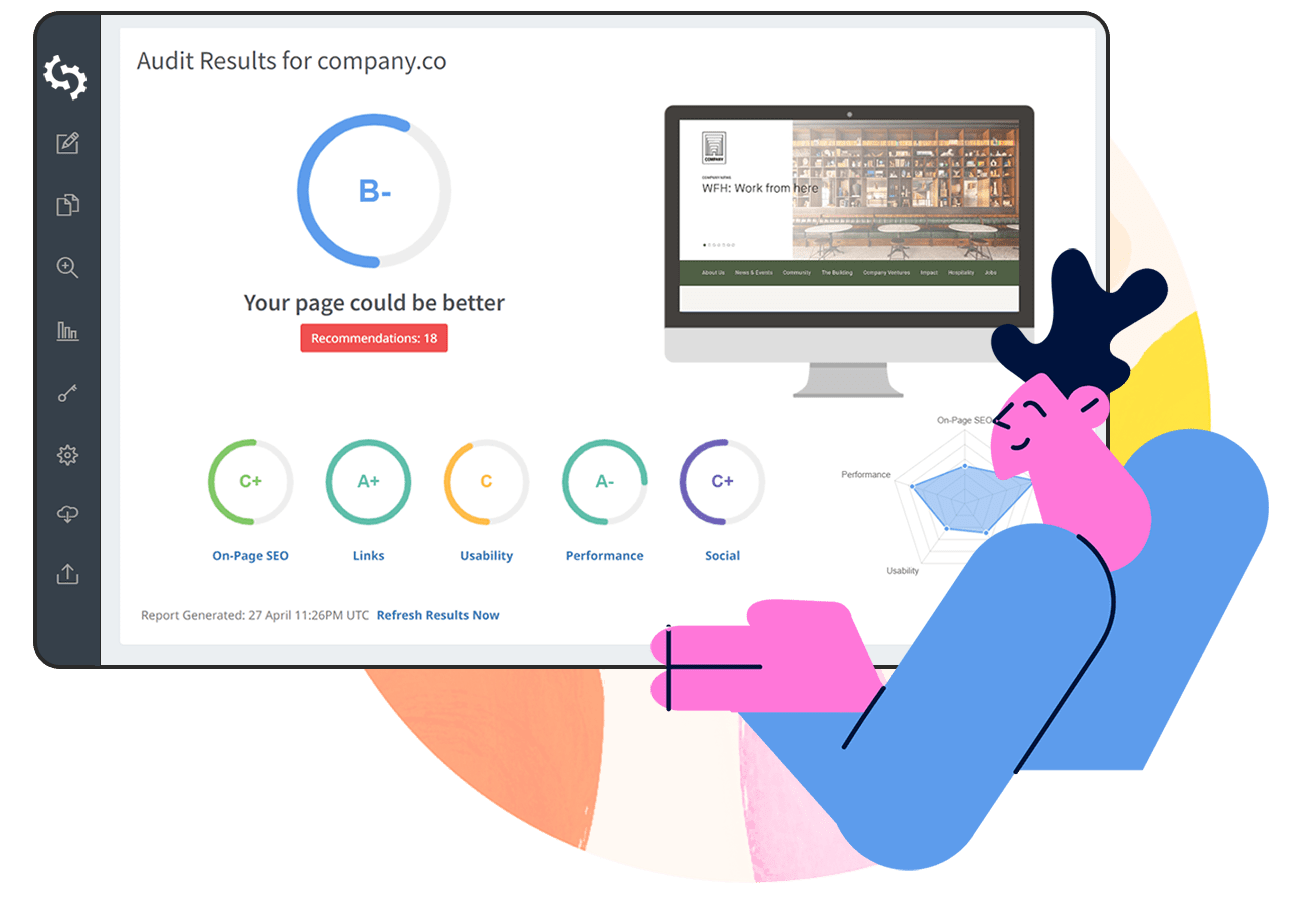
Search engine optimization forms the basis of many digital marketing campaigns. Additionally, SEO is one of the most significant contributors to increasing organic traffic and targeted leads.
But creating a successful SEO campaign is about more than just deciding which keywords to target. As time passes, marketers need to be able to track and report on multiple SEO metrics to management and clients.
This is where SEO reporting dashboards come in handy.
What is an SEO Reporting Dashboard?
Simply put, an SEO reporting dashboard is a tool that agencies and businesses can use to track and showcase the performance of their SEO campaigns.
Some of the metrics that an SEO reporting dashboard tracks include organic traffic, conversions, time spent on site, backlinks, and more.
An SEO report dashboard consolidates all of the SEO data from various places (e.g. Google Analytics, Google Search Console, Ahrefs, SEMrush, GMB, etc.) and organizes the information in an easy-to-access central location.
Why is it Important to Use SEO Reporting Dashboards?
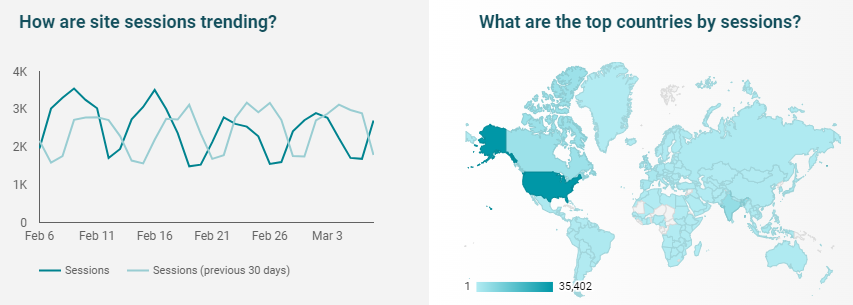
SEO reporting dashboards are useful because they give website owners insights into how they are performing in the SERPs. They can also serve as a warning that an important SEO metric needs to be attended to.
For example, if an SEO agency notices that a website’s top-performing blog article is losing search rankings, then they can try to figure out the reason(s) for the loss in rankings.
![]()
Image source: Quora
Another reason why it’s important to use an SEO report dashboard is that it enables marketing teams to present their progress to the upper management team and/or clients.
What’s the Difference Between a Dashboard and a Report?
Now you may be wondering, “an SEO reporting dashboard sounds just like an SEO report?”
And yes, both a dashboard and an SEO report essentially convey the same information, but there is a subtle difference between the two.
An SEO report is usually more complex and lengthy in nature, whereas an SEO reporting dashboard only gives a brief, live overview of certain key metrics.
Key Sections of SEO Reporting Dashboards
Now that you have a better understanding of what an SEO reporting dashboard is and why you should make use of one, let’s discuss some of the key sections that all SEO marketing dashboards should have.
It’s important to remember that each business is unique and therefore requires different SEO metrics to be included in an SEO report dashboard.
For instance, a large national eCommerce company will be more interested in the number of organic conversions on its website, whereas a local brick-and-mortar store will be more interested in its rankings in local search results.
Organic Traffic
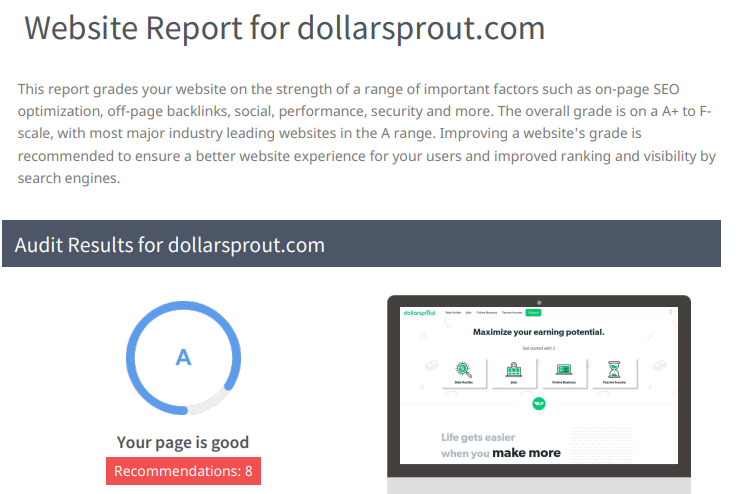
The first important section of an SEO reporting dashboard is the organic traffic metric. Increasing organic traffic is probably one of the main goals of any search engine optimization strategy.
By being able to show if organic traffic is increasing or decreasing, an agency can ensure clients that their investment in SEO is paying off.
And clients love it when they can see that their website is getting more organic traffic.

Key questions that an SEO dashboard should be able to answer with regards to organic traffic are:
- How much organic traffic did the website get in the last month?
- Did organic traffic decrease or increase?
- What was the average session duration in the last month?
- Which devices and browsers did users use to access a website?
These questions are important to ask because if a client’s website isn’t generating sufficient organic traffic then there could be a number of things an agency needs to focus on improving.
Maybe the keywords that a page is trying to target are just too competitive. Or perhaps, there’s no search demand for the topic that a page is targeting.
An SEO reporting dashboard should also be able to clearly indicate how much traffic a website is getting from paid marketing versus SEO and other forms of digital marketing such as email and social.
Keyword Rankings
Organic traffic from SEO is important, but ranking for the most relevant keywords is even more important for the success of any SEO campaign.
An agency should be able to tell its clients how rankings have improved or declined for target keywords over a certain period of time.
![]()
Additionally, if your client’s website isn’t ranking for the target keywords, then they won’t be getting any conversions from their SEO efforts.
By determining if a website doesn’t rank for target keywords, an agency can shift its focus on producing more content on the specific topic or building links to already existing content.
Core Web Vitals Metrics
Core Web Vitals are a set of metrics that measure a website's user experience.
These metrics form part of Google’s overall page experience score and are ultimately used alongside all their other ranking signals.
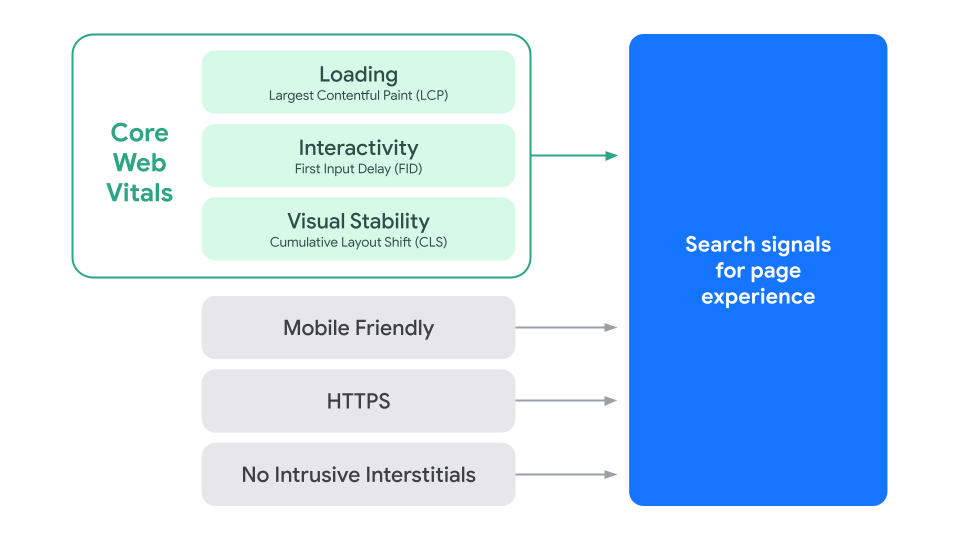
An SEO reporting dashboard should be able to give real-time insights into the 3 core web vitals metrics:
- Largest Contentful Paint (LCP)
- First Input Delay (FID)
- Cumulative Layout Shift (CLS)
Ideally, a reporting dashboard should show a comparison between your client’s website and their competitors’ websites.
This will give a good indication of whether an agency needs to focus on improving certain elements of a website such as its loading speed, certain website elements such as buttons, and mobile responsiveness.
By showcasing how you’ve improved a client’s Core Web Vitals, you’ll reinforce your client’s perception that you know what you are doing and that they are getting value for their money.

Landing Page Conversions
Being able to measure and showcase conversions from organic traffic is the ultimate goal of any SEO report dashboard.
Conversions from SEO can come in various forms, ranging from purchases, newsletter signups, calling a local business, or getting visitors into a marketing funnel.
Knowing how many conversions a client’s website is getting is powerful, but being able to determine which landing pages have resulted in those conversions is even more powerful.

By knowing which landing pages are generating the most conversions, an agency will be able to replicate subsequent landing pages using the same format.
Links Gained and Links Lost
The more links that a website has pointing back to it, the more authoritative that website will be seen in the eyes of Google.
This has a ripple effect because the more authoritative a website, the higher the odds of it ranking in the top position on search engine results pages.
Backlinks have a direct impact on search rankings and have been confirmed to be one of the top ranking factors.
It’s essential that agencies add link-building as part of their SEO strategies for all their clients.
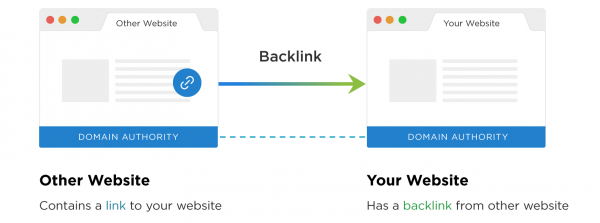
Image source: Backlinko
An SEO reporting dashboard should indicate how many new links a website has gained and how many old links it has lost.
If an agency notices that a client’s website is losing old backlinks then it should focus more on different outreach strategies such as link outreach, guest posting, or broken link-building.
Many times, a standard SEO contract will stipulate how many new links an agency has to build for its clients for the duration of the contract.
By tracking and measuring the number of new links built, an agency can prove to its client(s) that they are putting in the work as stipulated in the contract.
Google Business Stats (if applicable)
All local businesses should be able to view their Google Business metrics in their SEO reporting dashboards.
These metrics will reveal how well a business is performing in the local search results. The 3 main local SEO stats that a business should be able to view are:
- Local search rankings
- Number of Google reviews
- Average review rating
Local Rankings
One of the most important local SEO metrics is local rankings.
Similar to the keyword rankings metric, the local rankings metric tracks how well a website is ranking for local search results such as “car wash near me” and “plumbers in Scranton”.

If your client is a local business and they’re trying to improve the awareness of their business in the local community, then the local rankings metric should be included in its SEO reporting dashboard.
Number of Google Reviews
Word of mouth marketing has a big impact on a business's success. Nowadays, word-of-mouth marketing occurs online in the form of the reviews that a business receives.
The number of online reviews a business receives can be a strong indication of its trustworthiness, authority, and popularity in the local community.
Google determines local rankings by scoring a business’ relevance, distance, and prominence. As a result, the number of online reviews a business generates has a direct impact on its prominence.
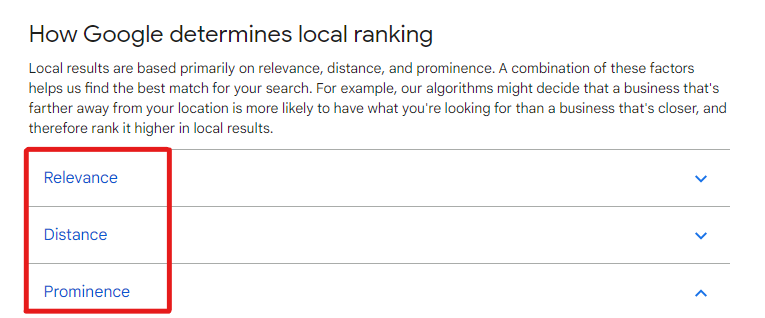
It’s therefore very important that this metric be added to an SEO reporting dashboard.
If a business has got none to very few reviews, then it can be an indication that it’s not a very popular business in the local community.
If this is the case, then review generation should be added to its mix of marketing activities.
Average Review Rating
The average review rating metric will reveal what other people and previous customers think of your client’s business.
By boasting a high average review rating in Google, a local business is likely to be trusted more than one with a lower average review rating.
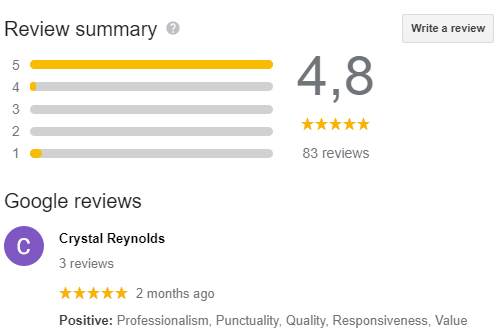
Obviously, a high review rating is the ultimate goal, but there is value in getting a few reviews with negative criticism.
A low average review rating will reveal how a business can improve its service delivery or products.
Because of the valuable feedback that the average review rating provides a business, it’s essential to include this in an SEO reporting dashboard.
As mentioned at the start of this section, each business is unique and has different KPIs that need to be measured and objectives that need to be reached.
By first determining what your business and SEO objectives are, you’ll be able to get the most out of your SEO dashboard.
Once you’ve established what SEO metrics and KPIs are the most important, it’ll be easy to create the best SEO reporting dashboard for you or your client’s website.
SEO Reporting Dashboard Tools
There are many different SEO reporting dashboard tools that agencies and businesses can use to get real-time insights on their SEO performance.
If you’re looking for a free SEO marketing dashboard tool then Google’s suite of tools is your answer.
The tools in question are:
- Google Analytics
- Google Search Console
- Google Business Insights
- Google Data Studio
You can use Google’s tools to report on valuable SEO metrics and performance statistics.
Google Analytics
For instance, with Google Analytics you can monitor real-time traffic and which landing pages are generating the most conversions.

You can use Google Search Console Performance Report to monitor how a website performs in Google search results.
This report will reveal the following things:
- Which queries visitors have used to find your web pages.
- Average CTR and impressions of your URLs on Google Search Engine Results Pages.
- The average positions of your URLs in the SERPs.
Agencies can utilize Google Business Insights to get a better understanding of how a business is performing in the local search results.
This tool reveals what search queries customers have used to discover a business. Google Business will also give business owners the ability to view the number of reviews customers have left in the past.
Google Data Studio
You can also utilize Google Data Studio to create a dashboard that connects with multiple Google products such as Google Analytics, Google Ads, Google Search Console, and more!
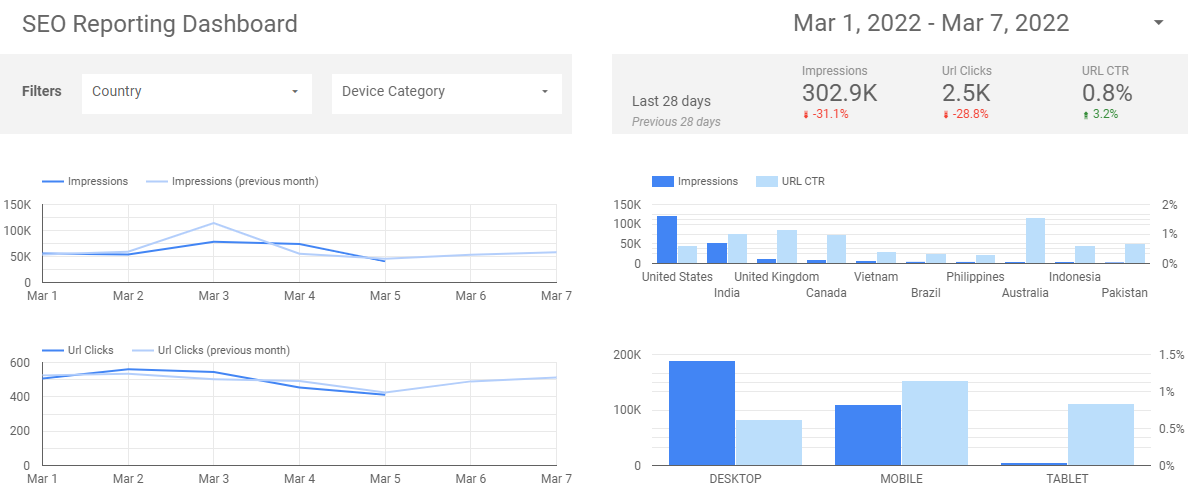
This can be extremely useful since agencies can create customized dashboards that give feedback on multiple metrics across different Google products.
SEOptimer
While SEOptimer doesn’t provide a live SEO reporting dashboard service, agencies and marketers can still utilize SEOptimer’s white label reporting functionality to generate beautiful SEO reports.
SEOptimer will generate an SEO report that gives feedback on keyword rankings over time, page speed, number of backlinks, and many other important SEO metrics.
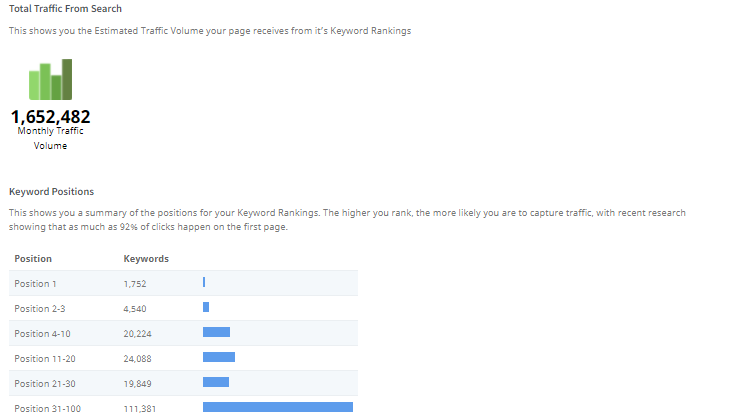
Simply just add the URL of the respective website and wait for our software to run checks on more than 100 data points.
How to Build SEO Reporting Dasboards
Step 1: Define Your Dashboard Goals and Metrics
The first step in building an effective SEO reporting dashboard is deciding on your key performance indicators (KPIs). A generic dashboard won't cut it—you need metrics that match your business goals. Here are some examples:
- Traffic Metrics
- Organic traffic
- New vs. returning visitors
- Engagement Metrics
- Average session duration
- Bounce rate
- Pages per session
- Search Engine Rankings
- Position for target keywords
- SERP click-through rates (CTR)
- Technical SEO Metrics
- Website speed
- Crawl errors
- Conversions
- Form submissions
- Revenue generated from organic traffic
By clearly defining your goals, you'll ensure that your dashboard remains focused and actionable.
Step 2: Get Access to the Necessary Data Sources
If you're creating the dashboard for a client, you'll need to get access to their Google Analytics, Google Search Console, Google Ads etc.
The steps will vary for each tool but you'll either get access to the tools via your own email or by a company provided email.
For most Google tools you'll need to navigate to the Settings or Admin section. In Google Analytics, you'll need to navigate to the Account tab and select Account access management.
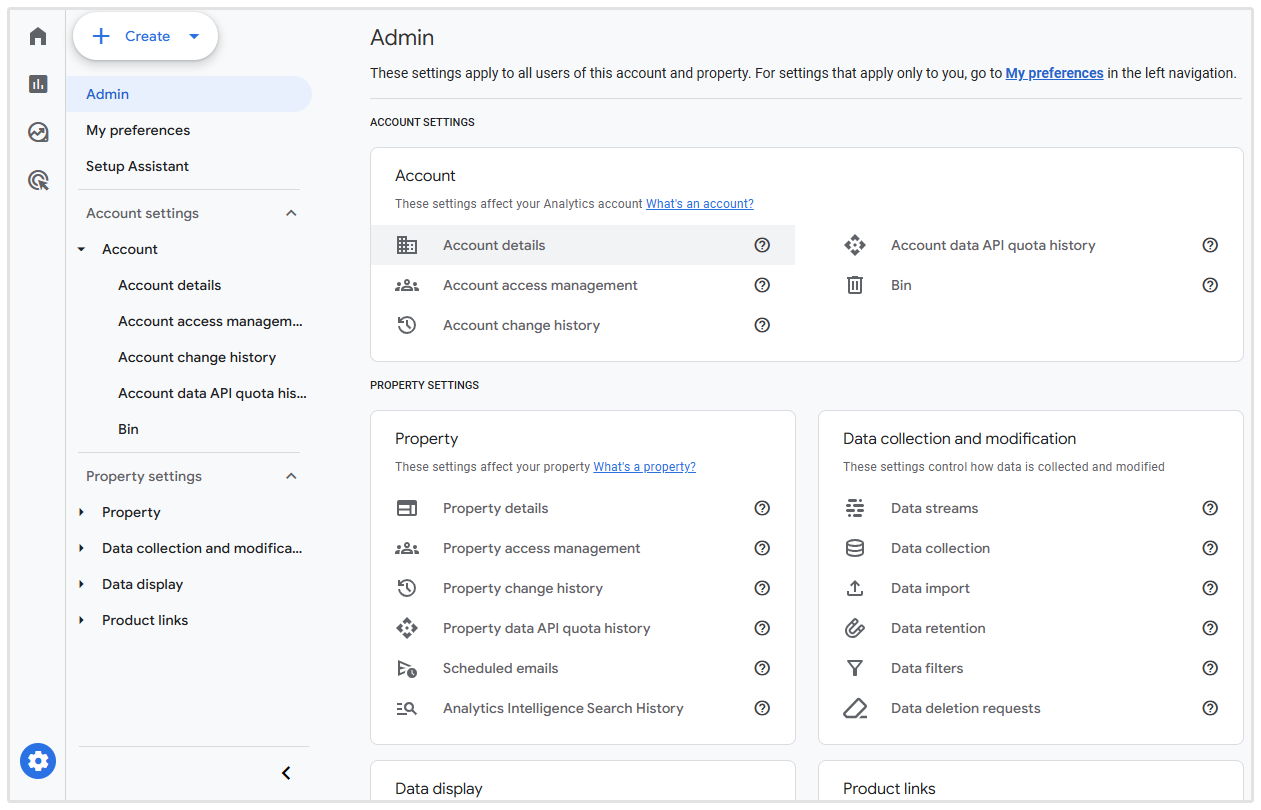
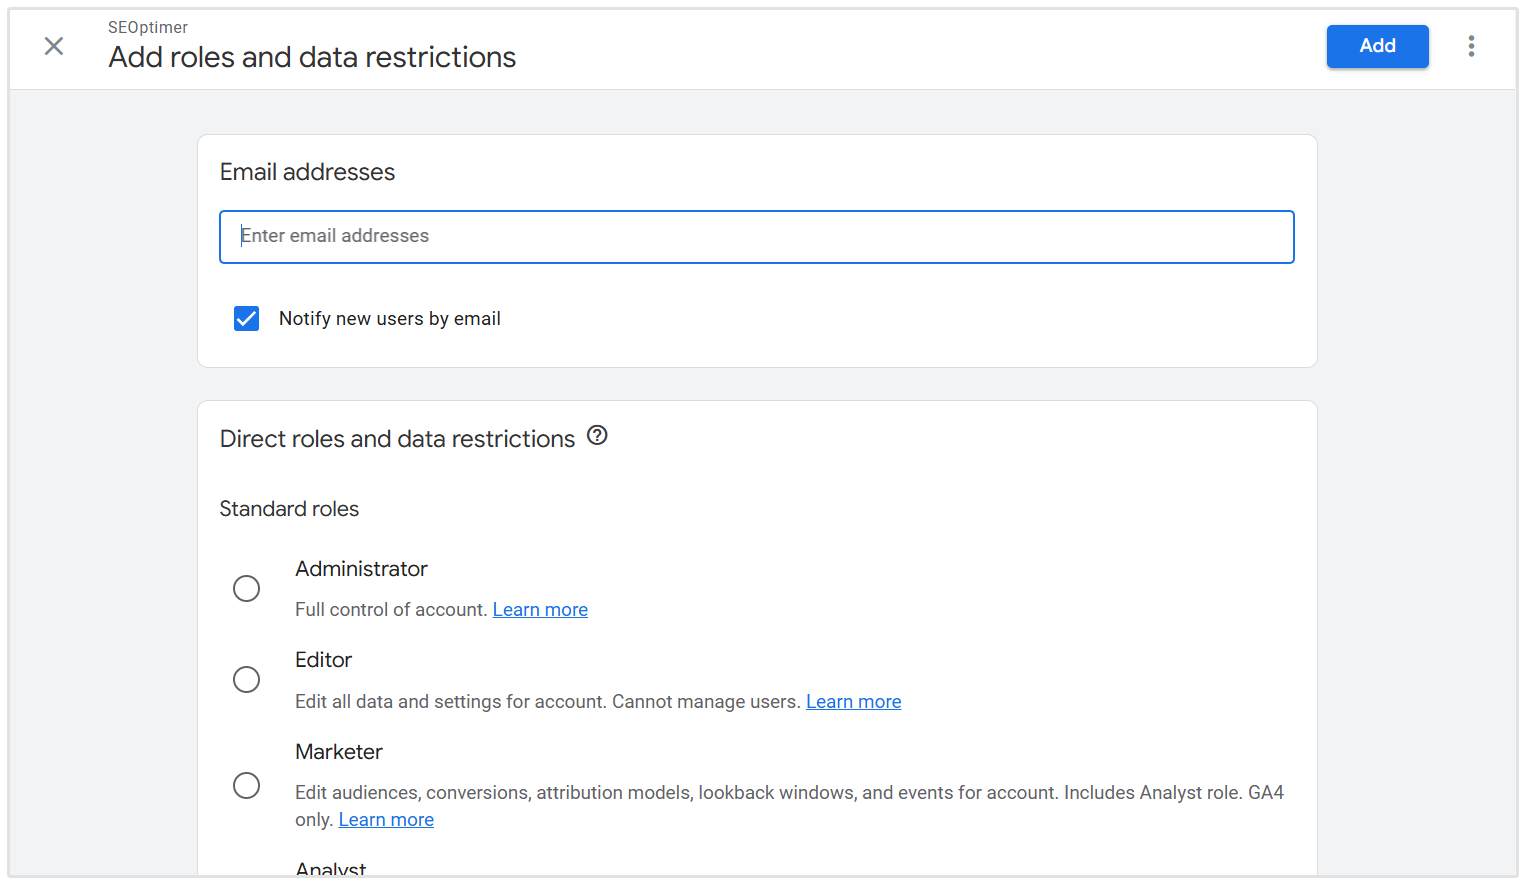
Thereafter click on the blue plus icon and select Add users. Your client will be prompted to fill in your email address and to assign your role and permissions.
.png)
In GA4, the editor or marketer role would be best as this allows you full access to all the data you would need for your dashboards.
Once you've got permissions to the data sources it's time to plan your dashboard.
Step 3: Plan Your Dashboard Layout
Your dashboard should present data in a way that’s easy to understand at a glance. Consider organizing it into the following sections:
Overview
-
High-level metrics like total organic traffic, average session duration, and total conversions.
Traffic Analysis
-
Organic sessions by location or device type.
-
Week-over-week or month-over-month comparisons.
Keyword Performance
-
Top-performing keywords and their rankings.
-
Average CTR and impressions per keyword.
Technical SEO Insights
-
Page load time.
-
Crawl errors or 404s.
-
Core web vitals
Conversion Tracking
-
Revenue or lead metrics tied to SEO efforts.
Backlink Activity
-
Links gained and lost
Local SEO Insights
-
Average ratings
-
Local rankings
A great option is to start with one of the existing templates available in Looker Studio, like the Search Console template.
This template loads some dummy data which makes it easier to visualize what your report will look like. There's also a Google Analytics and Google Ads template. Alternatively you can use our custom template.
Step 4: Build the Dashboard in Looker Studio
Now that your data sources are linked and your layout is planned, it’s time to start building.
Create a New Report
Log in to Looker Studio and click "Blank Report." Give your report a meaningful name such as "SEO Performance Dashboard."

Add Data Sources
Click "Add Data" and connect the data sources you added earlier. You can bring in data from Google Analytics, Search Console, and other platforms.
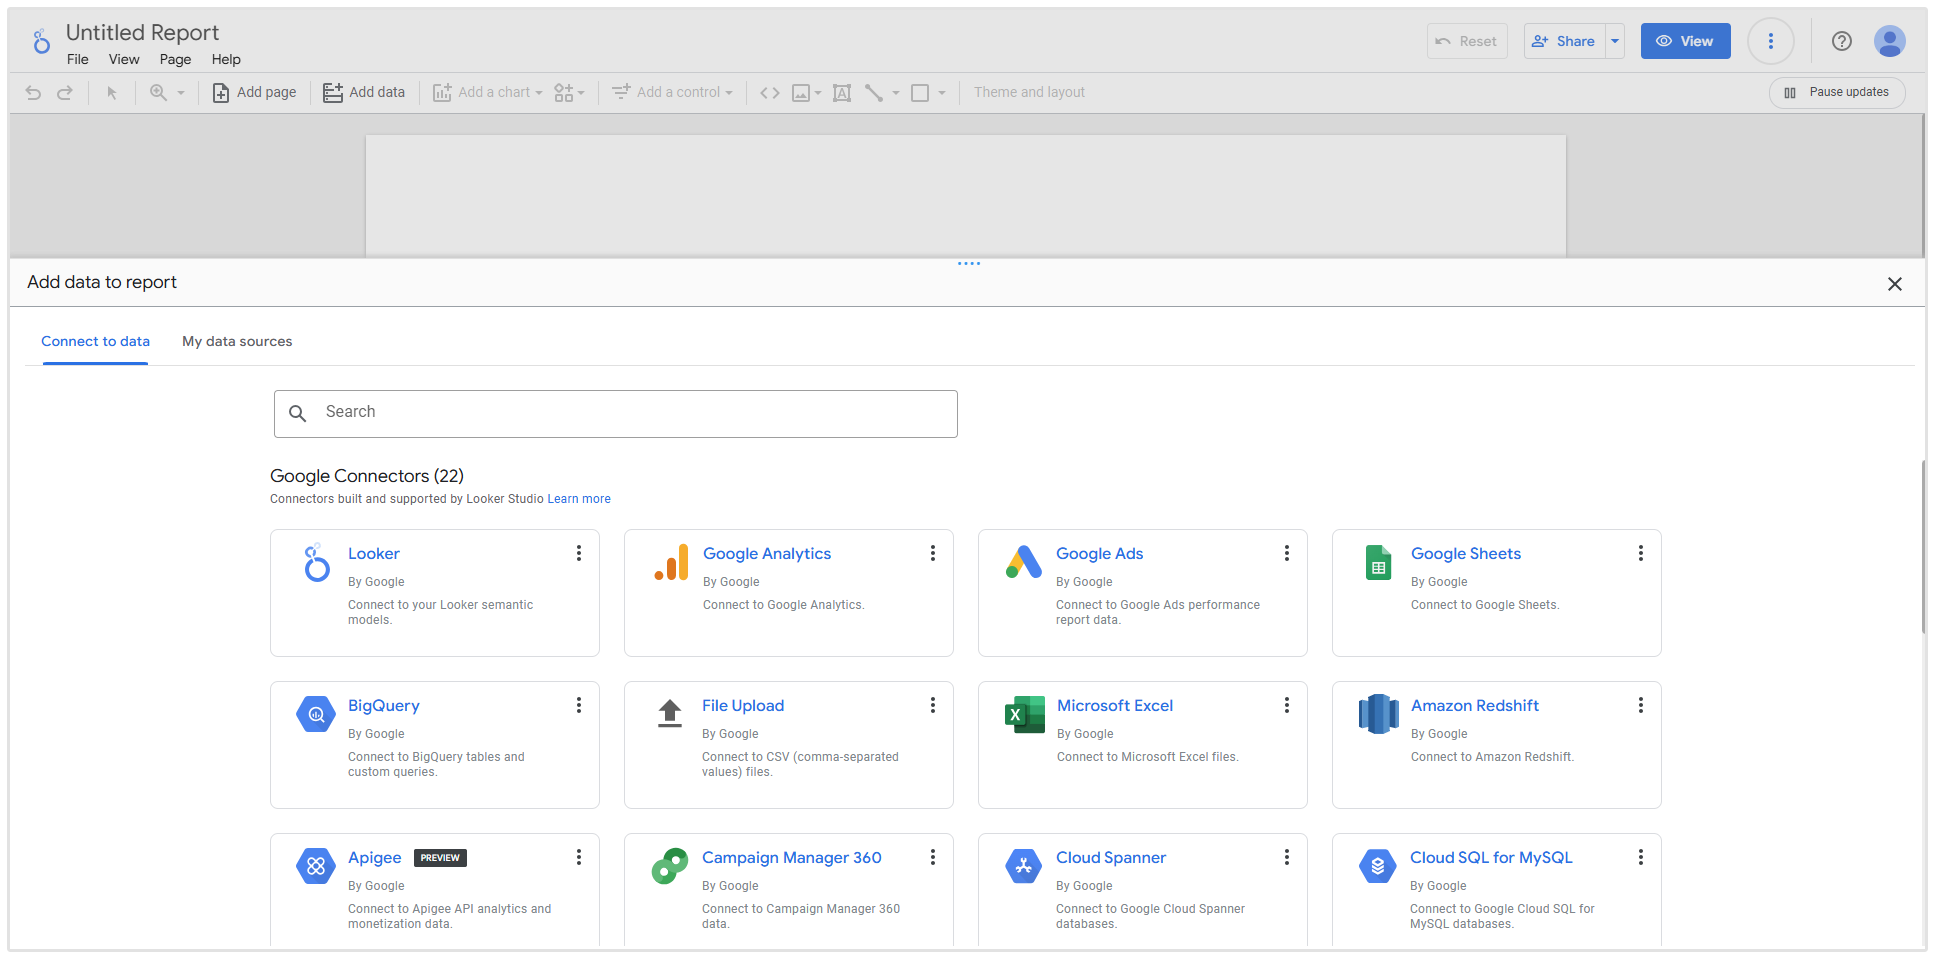
Visualize Your KPIs
Use the drag-and-drop interface to add charts, scorecards, tables, and graphs to your dashboard.
For example, a line chart showing monthly organic traffic trends can go in the "Traffic Analysis" section.
Customize Your Design
You can customize your SEO reporting dashnoards however you like however a good place to start is by apply filters to refine data (e.g. organic traffic only), adding color codes for visual clarity(green for growth, red for decline) and adding your company branding.
Enable User Interactivity
Incorporate dropdowns and date range selectors so stakeholders can view KPIs for specific periods or campaigns.
If you've used any of the existing templates then you'll need to click on the "use my own data'' button.
If you've selected the Search Console template, make sure to import both the Site and URL data.
Once the data has been imported you can edit the dashboard to your liking by clicking on the "edit and share button'.
Step 5: Refine and Iterate Your Dashboard
Dashboards aren't set in stone—they should evolve as your SEO strategy does.
Gather Feedback: Ask stakeholders if the dashboard provides the insights they need.
Expand Metrics: Add seasonal or campaign-specific metrics like holiday traffic spikes.
Adjust Visualizations: Refine charts or layouts to improve readability and flow.
SEO Reporting Dashboard Template
We created a free SEO reporting dashboard using Google Data Studio. You can use this template to monitor and share valuable SEO metrics of your own website or your client’s site.
Simply copy the report and connect your Google Analytics, Search Console, and Business account to get started.
Conclusion
Businesses that are serious about improving their SEO performance need to make use of SEO reporting dashboards.
An SEO marketing dashboard gives business owners and marketers real-time insights into how their websites are performing in search engines. These reporting dashboards can also give useful feedback on whether or not your SEO efforts make a difference in improving website performance.
